

Debugging NiFi Data Flows: Proven Techniques Every Developer Should Know
![]()
Apache NiFi has become a cornerstone for data flow automation, offering a powerful and flexible way to move, transform, and monitor data across systems. However, with great flexibility comes complexity. Debugging NiFi data flows, especially in large-scale or production environments, can become challenging without the right techniques and tools in place.
In this blog, we’ll walk you through proven debugging techniques every NiFi developer should know, covering both the built-in tools NiFi offers and best practices from the field. We’ll also introduce a game-changing tool – Data Flow Manager by Ksolves – which simplifies error tracking and accelerates the debugging process.
Understanding NiFi Data Flows and Common Issues
At its core, an Apache NiFi data flow is a seamless orchestration of processors, connections, and controller services that work together to ingest, route, transform, and deliver data across systems. While the platform is designed for scalability and flexibility, troubleshooting can become complex when things go wrong, especially in production environments.
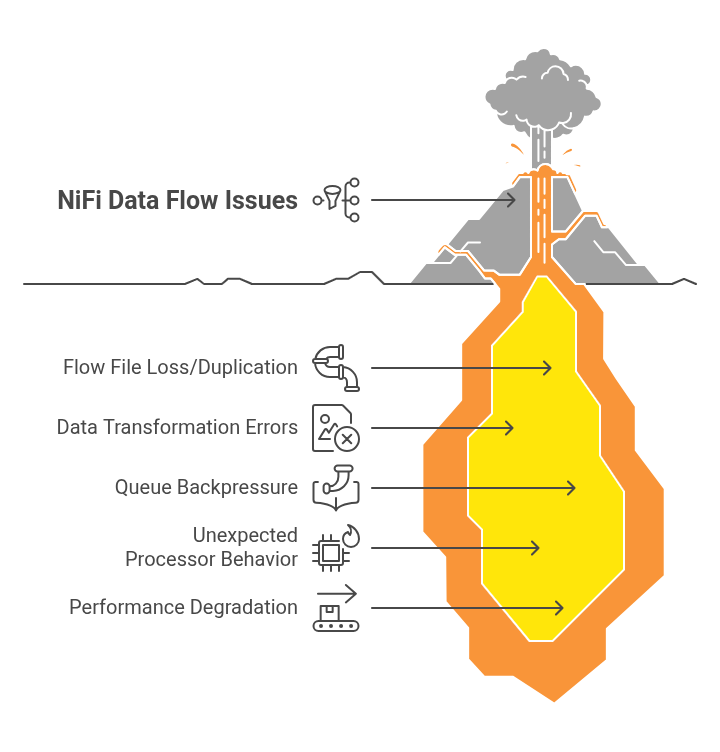
Some of the most common issues developers encounter include:
- Loss or duplication of flow files due to incorrectly configured processors, faulty routing logic, or improper handling of success/failure relationships.
- Data transformation errors, such as invalid JSON/XML parsing, schema mismatches, or malformed content during enrichment stages.
- Queue backpressure, where an overload of flow files causes downstream processors to pause, leading to flow bottlenecks.
- Unexpected processor behavior, often caused by incorrect processor properties, missing parameters, or misapplied expression language.
- Performance degradation in clustered or high-throughput environments, triggered by network latency, uneven node workloads, or resource exhaustion.
Identifying these patterns early on, and understanding their root causes, is the first step toward mastering NiFi debugging and building resilient data pipelines.
Setting Up Your NiFi Environment for Effective Debugging
Before diving into advanced troubleshooting techniques, it’s essential to set up your NiFi environment in a way that maximizes visibility and transparency. A well-configured environment can drastically reduce the time spent diagnosing issues and improve overall reliability.
Key setup steps to enhance your debugging capabilities:
- Enable detailed logging by adjusting settings in both nifi.properties and logback.xml. Fine-tuning these configurations ensures that important processor and system-level activities are logged for analysis.
- Leverage the Provenance Repository to retain a comprehensive history of flow file events—such as creation, modification, routing, and drops. This makes it easy to trace the lifecycle of a flow file and uncover where things may have gone wrong.
- Activate the Bulletin Board for real-time visibility into processor warnings and errors. This feature acts like an in-app notification system, providing immediate insights into operational issues.
- Set appropriate log levels for different components to balance verbosity and clarity. Too much noise can bury important events, while too little detail can leave you blind to underlying problems.
A proactive and thoughtful setup of your NiFi environment lays the foundation for efficient debugging, helping you resolve issues faster and with greater confidence.
Step-by-Step NiFi Data Flow Debugging Techniques
Once your NiFi environment is configured for observability, you’re ready to dive into hands-on debugging. These core techniques will help you trace issues, isolate faults, and resolve errors efficiently across any data flow.
1. Using Data Provenance to Track Flow Files
The Data Provenance feature is one of NiFi’s most powerful debugging tools. It enables you to visually trace the complete lifecycle of each flow file.
- Track where a flow file originated, how it moved through the flow, which processors modified it, and when.
- Apply filters to find failed or delayed events quickly, based on time, processor, or outcome.
- Drill into individual provenance events to view attribute changes, content modifications, and transfer times.
By reconstructing the exact path of a file, you can diagnose transformation errors, routing issues, and data loss with precision.
2. Leveraging NiFi Logs
Logs are your most detailed source of truth for what’s happening under the hood.
- The nifi-app.log file captures runtime activity, processor events, and system-level actions.
- Look for stack traces, validation failures, and exception messages that signal configuration or runtime issues.
- Use tools like grep, tail -f, or centralized log aggregators (e.g., ELK stack, Splunk) to analyze logs in real time or over time.
Logs are especially useful when NiFi components crash silently or behave unpredictably, surfacing clues that the UI might miss.
3. Employing the Bulletin Board
The Bulletin Board offers real-time visual feedback for processor-level problems.
- Processors with recent warnings or errors are flagged with red icons in the canvas.
- Click the icon to view timestamped messages, including configuration errors, script failures, or missing relationships.
- Think of it as your flow’s health dashboard, a quick way to spot trouble without digging through logs.
It’s particularly effective for catching misfires during deployments or after property changes.
4. Monitoring Queues and Managing Backpressure
Queue metrics are essential for identifying bottlenecks or downstream failures.
- Right-click on a connection to view the current flow file count, queue size, and data age.
- A growing queue often indicates that the downstream processor is slow, failing, or misconfigured.
- Use this insight to:
- Tune backpressure thresholds.
- Enable concurrent tasks.
- Distribute load using load-balanced connections or funnel structures.
Proactive queue monitoring prevents flow blockages and helps optimize throughput.
5. Testing with Sample Data
When diagnosing issues, isolate the problem by testing in a controlled environment.
- Use the GenerateFlowFile processor to simulate data inputs with known parameters.
- Temporarily disable downstream processors and enable processors incrementally to test behavior in steps.
- Create test templates for experimentation, allowing you to debug safely without risking production flows.
This approach is invaluable for validating logic, reproducing issues, or introducing new components without unexpected side effects.
Simplify NiFi Data Flow Debugging with Data Flow Manager
While Apache NiFi offers powerful native tools, debugging complex, large-scale, or multi-environment flows can still be a time-consuming and fragmented process. Data Flow Manager simplifies this. Designed meticulously to simplify the deployment or promotion of NiFi flows, DFM offers a feature that makes identifying errors in NiFi data flows effortless.
Why it’s a game-changer:
- Centralized Error Dashboard: Visualize all data flow errors across processors in one unified interface, no more digging through logs or toggling between processors.
- Real-Time Monitoring Across Environments: Instantly detect failures across your Development, Staging, and Production environments, ensuring faster response and reduced downtime.
- Direct Issue Navigation: Jump directly to the processor or flow where the issue occurred, saving time, effort, and frustration.
- Enterprise-Grade Scalability: Designed for teams managing hundreds of NiFi flows, Data Flow Manager supports efficient DevOps and DataOps processes across large organizations.
Conclusion
Debugging NiFi data flows doesn’t have to be overwhelming. By understanding common issues, setting up your environment for visibility, and applying step-by-step and advanced techniques, developers can identify and resolve problems with confidence and precision.
With tools like Data Flow Manager by Ksolves, the debugging process becomes even more streamlined, offering real-time visibility, centralized error tracking, and seamless navigation. It’s a must-have for teams looking to scale their NiFi operations with speed and stability.
![]()
